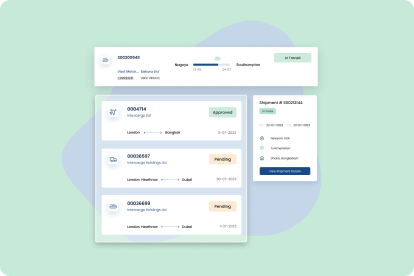
Discover your all-in-one digital freight platform
Escape the chaos of calls, faxes, and endless emails. Step into a connected world where suppliers, shippers, customs, ports, and more unite on a single platform for seamless, contextual collaboration
Let us help you 24/7 manage your supply chain needs


Being an IATA accredited agent we have access to over 121 airlines, this includes scheduled freighters and passenger aircrafts.
With our LCL service, you can ship as little or as much as you like, weekly consoles are our business and get you yours.
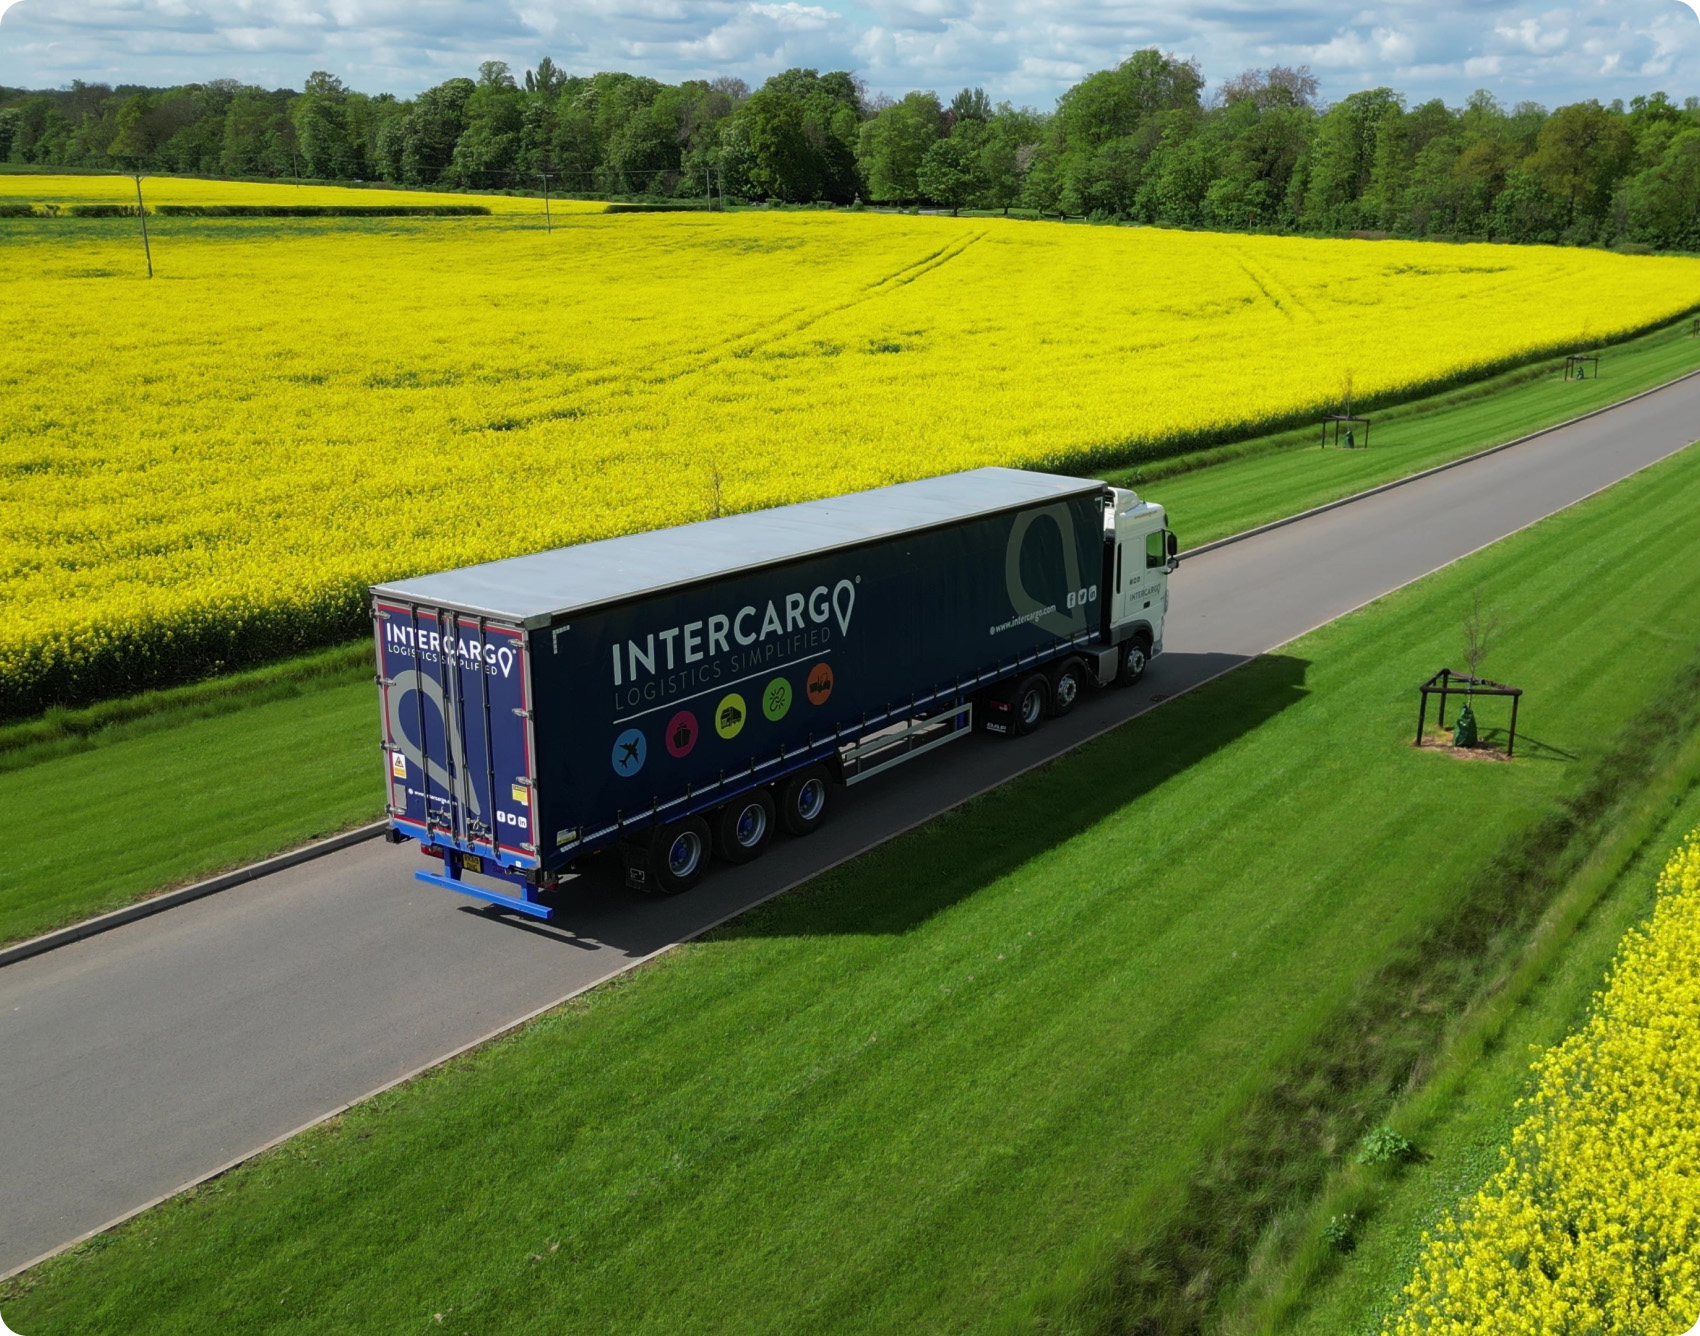
We provide comprehensive road freight services, covering both Less-Than-Truckload (LTL) and Full-Truckload (FTL) options.
To meet your requirements we have access to vehicles of all sizes from small vans to artic with 24/7 availability and live tracking.
Escape the chaos of calls, faxes, and endless emails. Step into a connected world where suppliers, shippers, customs, ports, and more unite on a single platform for seamless, contextual collaboration
Our solutions are tailored to fit your business and its unique workflows, offering real-time order tracking from placement to delivery. Stay informed with up-to-date order statuses, track progress, and receive timely notifications for key milestones, whether shipping by air, sea, or road.

For packages requiring urgent delivery that can be achieved by road to destinations in the UK or mainland Europe, you can rely on Intercargo to deliver direct in the fastest time possible.
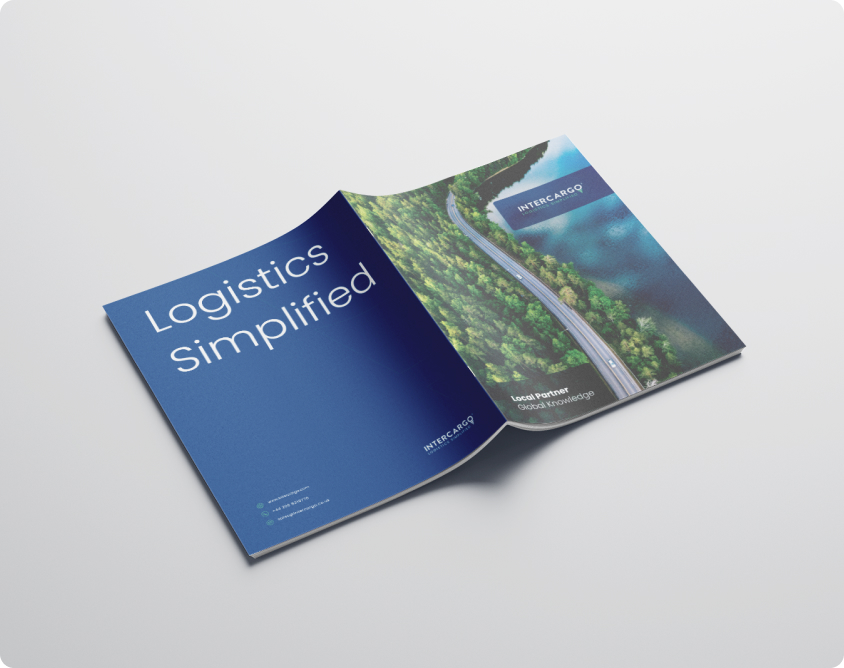
Get to know more about values, knowledge and experience, quickly download our company profile.

Analysis: DHL Group - the bear dance - The Loadstar
There's a rare diverging view on DHL Group and its prospects in the equity markets, while industry executives try cautiously to assess the current environment for the trade, downplaying downside risk for value. On the one hand, the bulls like the soft legal restructuring that the German group is undertaking, optimistically stating that the financial/operational risk posed to Express, DHL's chief earnings contributor, is manageable. On the other hand, one bear has turned even more bearish this week, ...
Source: theloadstar.com
Read more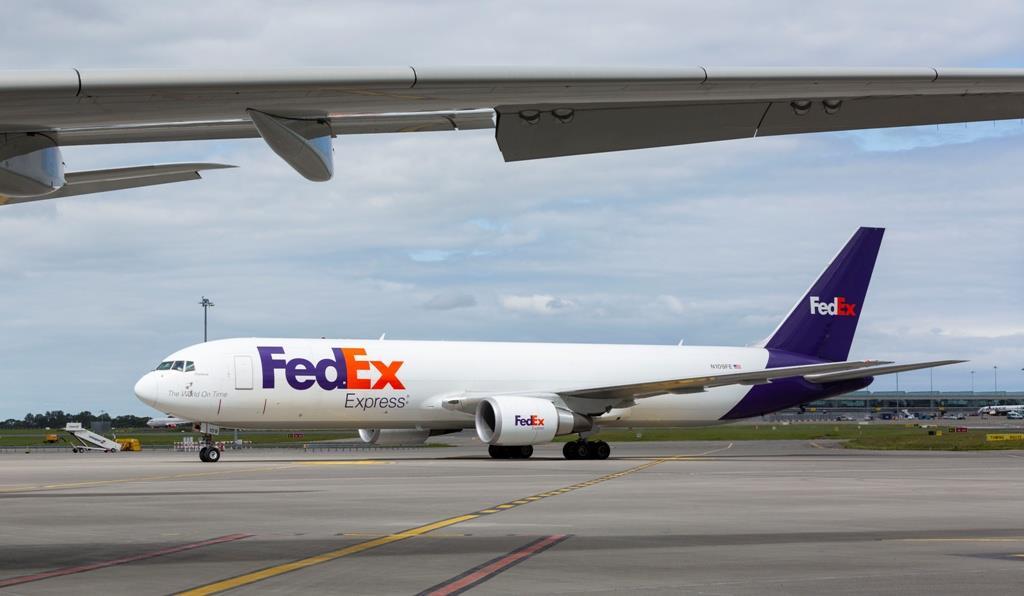
FedEx retires aircraft as it faces volatile demand environment
FedEx retired 12 aircraft in its fiscal fourth quarter as the company sought to align network capacity with anticipated demand. During the quarter, the express giant saw revenues increase 0.4% year on year to $22.2bn, operating income improve by 14.7% to $1.8bn and net income increase 23.1% to $1.6bn. Profitability had improved on the back of its DRIVE structural cost reduction programme, the company said. Speaking on an investor call, Raj Subramaniam, FedEx Corp president and chief executive officer, said the company had faced major headwinds during the quarter including "the expiration of our US postal service contract, two fewer operating days and volatility and uncertainty related to global trade policy". During the quarter, the company also removed seven Airbus A300-600 aircraft, three MD-11 aircraft, and two Boeing 757-200 aircraft, plus eight related engines, from its fleet at a cost of $21m. "These retirements are aligned with the company's fleet reduction and modernisation strategy as the company continues to improve its global network efficiency and better align air network capacity with anticipated demand," FedEx said. The company now operates 90 Boeing 757 aircraft, 34 MD-11Fs and 58 A300 aircraft. In contrast, its 777 fleet has grown by two aircraft since last year to 59 and its 767s are up by seven aircraft to 145. It has plans to add a further seven 767s this year. Earlier this year, the company announced the order of eight Boeing 777 freighters and said it planned to extend the retirement of its MD-11Fs from 2028 to 2032. The company said that it also flexed its network to reflect demand developments as a result of the implementation of tariffs. "For example, in the fourth quarter, we flexed our network to match the demand environment as trade flows shifted," said Subramaniam. "We reduced capacity on our Asia to Americas lane by more than 35% in the first week of May compared to April. This included reducing our third-party or white tail capacity by 50%. We then continue to adjust the capacity as needed as demand trends evolve throughout the month." He added that the company had added direct flights from Singapore to the US to better capture increased demand out of Southeast Asia. Looking ahead, Subramaniam said: "The global demand environment remains volatile. We're staying close to our customers to help them plan and adapt as they navigate trade policy changes, and we are actively matching our capacity with demand as the environment evolves." Looking at divisional performance, its express division saw revenues increase by 1% to $19bn on the back of increased demand for US domestic and international economy services, while the weak industrial economy constrained demand for priority package and B2B services. Freight saw revenues decrease by 4% to $2.3bn as continued weakness in the industrial economy pressured revenues, along with lower fuel surcharges, reduced weight per shipment, and fewer shipments, partially offset by base yield growth. Last year's fourth-quarter results included a noncash impairment charge of $157m from the decision to permanently retire 22 Boeing 757-200 aircraft and an income tax expense of $54m as a result of the merger of its ground and service businesses into the express division.
Source: aircargonews.net
Read more
Krems, Smilianets and Claussen recognised by Tiaca
United Cargo's Jan Krems, Awery Aviation Software's Vitaly Smilianets and cargo.one's Moritz Claussen were all recognised at the recent Tiaca Executive Summit in Hong Kong. At the event, United Cargo president Krems was inducted into the association's Hall of Fame. Krems was recognised for his "outstanding leadership", "unwavering focus" on the customer experience, and "continuous drive for innovation". "Under his direction, United Cargo has emerged as the largest U.S. combination carrier by air cargo volume -- a testament to his strategic vision and relentless pursuit of excellence," Tiaca said in a press release. "His influence continues to shape the future of the air cargo industry in meaningful and lasting ways." Krems added: "This recognition means a great deal to me -- not only as a personal milestone after nearly 40 years in this fantastic industry, but because it reflects a journey built with many people, in many places, over many years." At the same event, Smilianets, founder and chief executive of Awery, scooped the Inspirational Leader Award. The Inspirational Leader Award honours individuals who have "demonstrated outstanding leadership and vision while playing a key role in nurturing young talent and advancing the air cargo and logistics industry", Tiaca said. The award is judged by a panel of young professionals under 35. "Smilianets founded Awery Aviation Software with a vision to digitally transform air cargo operations and has since led the company to become one of the most dynamic tech providers in the industry," Tiaca said. "Beyond his achievements in business, he is widely admired for his mentorship, authenticity, and advocacy for digitalisation and transparency." "I am deeply honoured to receive this award; it reflects not just my personal journey, but the dedicated work of my teams at both Awery and CargoBooking to drive positive change for the industry," said Smilianets. "We have always believed in the power of technology to move this industry forward, and I am incredibly proud of what my team and I have achieved together so far." Meanwhile, Claussen, who is co-founder and co-chief executive of cargo.one, scooped the Rising Star Award. The award recognises outstanding individuals under the age of 35 who have demonstrated excellence, innovation, and impact in the air cargo and logistics sector, Tiaca said. "Claussen co-founded cargo.one with the vision of bringing seamless digital booking and visibility to airfreight, an area long underserved by digital solutions," Tiaca said. "Under his leadership, the platform has grown rapidly to become a trusted global partner for airlines and freight forwarders alike." Claussen added: "The award really belongs to the entire cargo.one team that passionately supports industry participants every day to optimise their digital success. "I feel grateful to be part of an air logistics industry that is breaking records and redefining standards, and this era of air cargo is surely the most exciting and personally fulfilling ever." Elsewhere at the event, Tiaca presented awards to the winners of the seventh edition of the Air Cargo Sustainability Awards, in partnership with CHAMP Cargosystems. The winner of the corporate award was Ostend-Bruges Airport, which was recognised for its biodiversity programme -- a project that "exemplifies how aviation and environmental stewardship can thrive side by side". The initiative fosters community engagement by partnering with local governments, farmers, and beekeepers, delivering direct benefits to stakeholders while increasing environmental awareness across the region. The start-up/small business category was won by Fraunhofer Institute for Material Flow and Logistics for its innovative Fraunhofer Institute for Material Flow and Logistics solution.
Source: aircargonews.net
Read more

This website uses cookies and similar technologies, (hereafter “technologies”), which enable us, for example, to determine how frequently our internet pages are visited, the number of visitors, to configure our offers for maximum convenience and efficiency and to support our marketing efforts. These technologies incorporate data transfers to third-party providers based in countries without an adequate level of data protection (e. g. United States). For further information, including the processing of data by third-party providers and the possibility of revoking your consent at any time, please see your settings under “Consent Preferences” and our