Discover your all-in-one digital freight platform
Escape the chaos of calls, faxes, and endless emails. Step into a connected world where suppliers, shippers, customs, ports, and more unite on a single platform for seamless, contextual collaboration
Let us help you 24/7 manage your supply chain needs


Being an IATA accredited agent we have access to over 121 airlines, this includes scheduled freighters and passenger aircrafts.
With our LCL service, you can ship as little or as much as you like, weekly consoles are our business and get you yours.
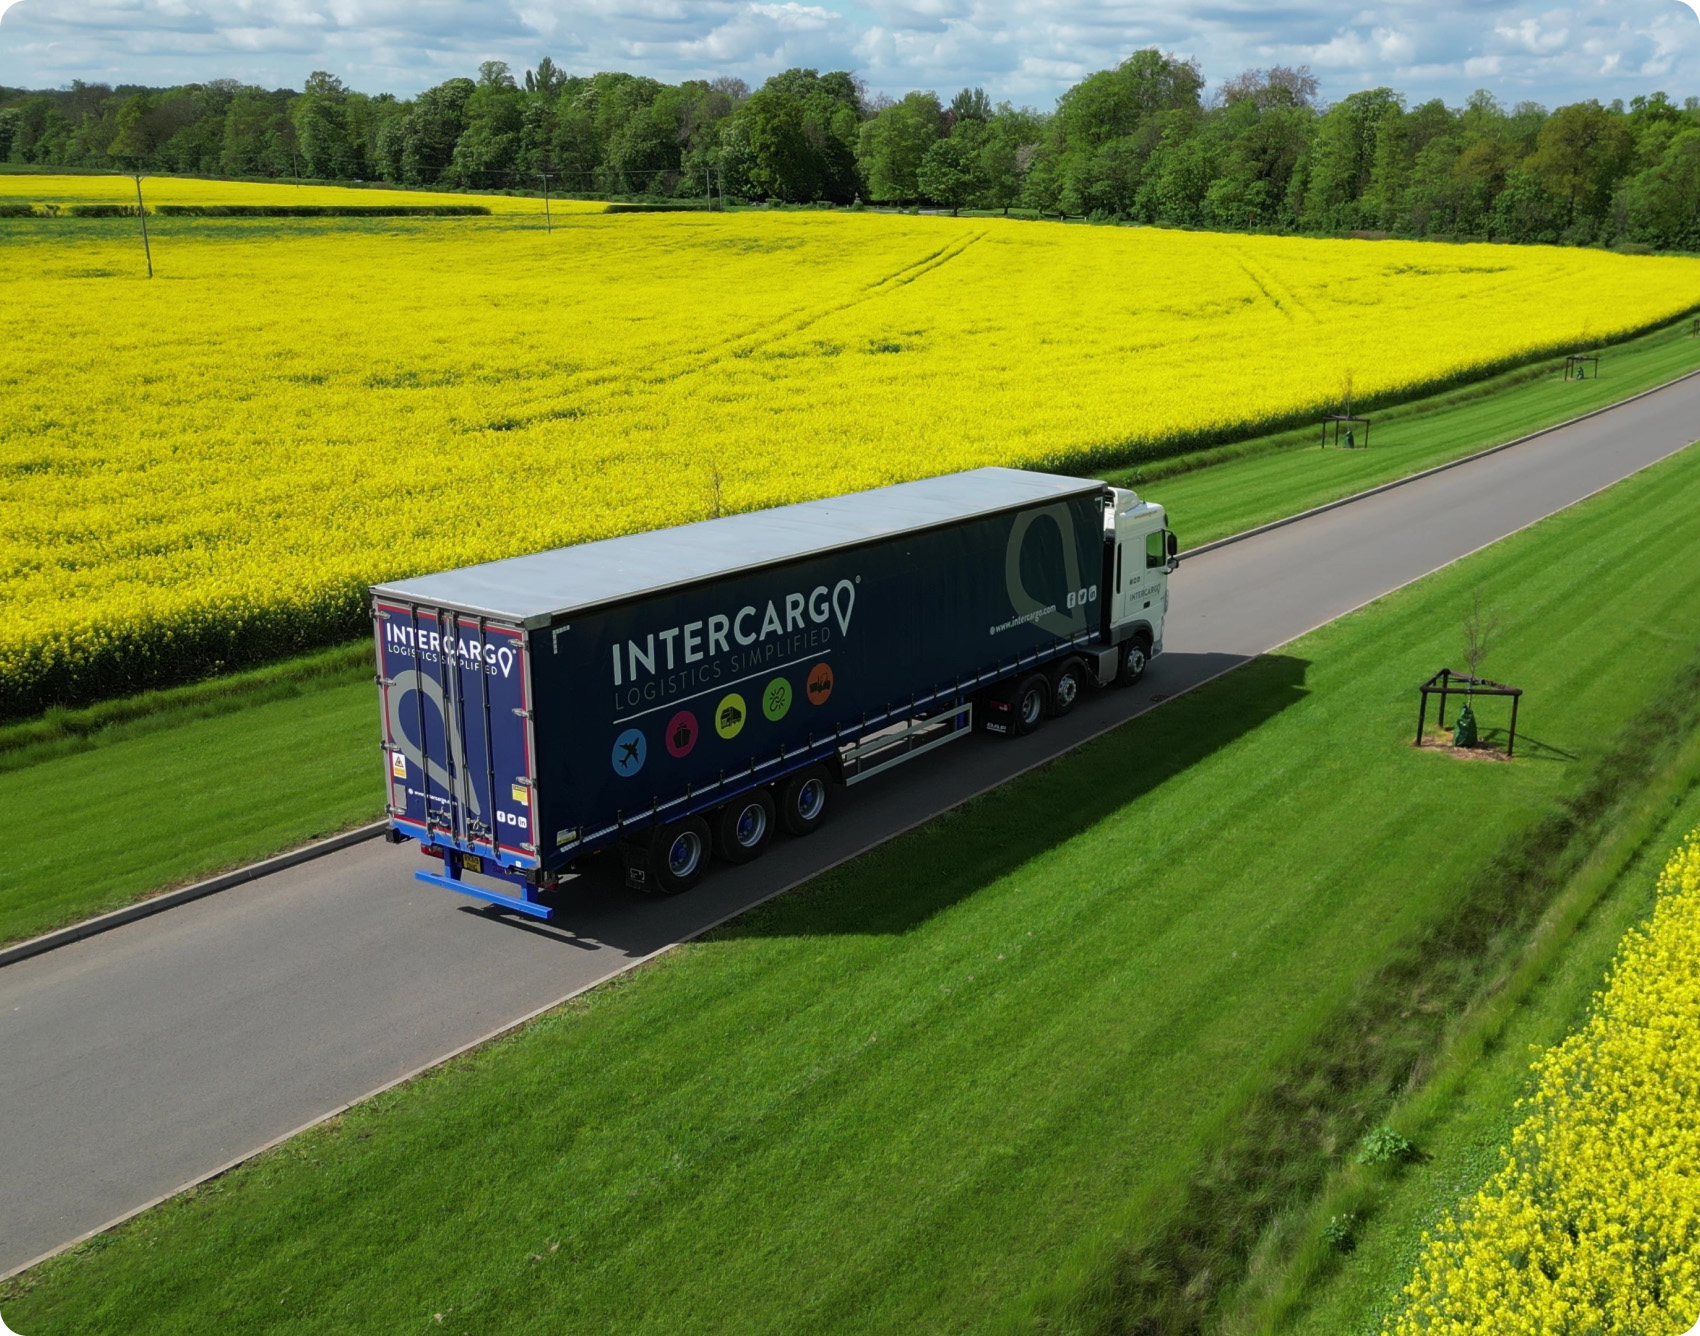
We provide comprehensive road freight services, covering both Less-Than-Truckload (LTL) and Full-Truckload (FTL) options.
To meet your requirements we have access to vehicles of all sizes from small vans to artic with 24/7 availability and live tracking.
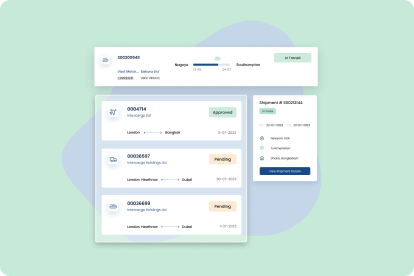
Escape the chaos of calls, faxes, and endless emails. Step into a connected world where suppliers, shippers, customs, ports, and more unite on a single platform for seamless, contextual collaboration
Our solutions are tailored to fit your business and its unique workflows, offering real-time order tracking from placement to delivery. Stay informed with up-to-date order statuses, track progress, and receive timely notifications for key milestones, whether shipping by air, sea, or road.

For packages requiring urgent delivery that can be achieved by road to destinations in the UK or mainland Europe, you can rely on Intercargo to deliver direct in the fastest time possible.
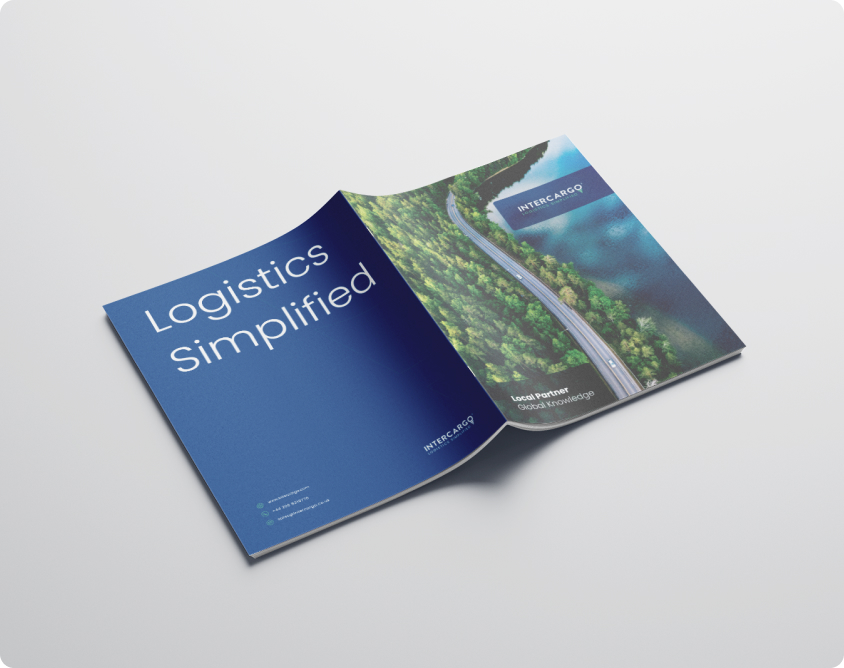
Get to know more about values, knowledge and experience, quickly download our company profile.

US airlines and forwarders welcome Trump's big beautiful bill
The US Airforwarders Association (AfA) and Airlines for America (A4A) have welcomed US president Donald Trump's "big, beautiful bill" being signed into law. The AfA said that the bill, which became law earlier in July, would include cash to modernise US aviation infrastructure, such as air traffic control and airport runways. The bill included $12.5bn for airport and air traffic control infrastructure projects over the next four years. "The One Big Beautiful Bill Act is a landmark moment for the air cargo and logistics industry," said AfA executive director Brandon Fried. "This legislation delivers the modernisation our industry has long needed from billions in Federal Aviation Administration funding to overhaul outdated radar, telecommunications, and air traffic control (ATC) systems, to major investments in runway safety and airport surveillance." Lobbying group A4A also welcomed the bill being signed into law. "For years, A4A has been sounding the alarm about ATC staffing shortages and antiquated equipment, such as copper wires and floppy disks," the airline group said. "Given the challenges facing the air traffic system, these funds are a vital down payment on updating the technology that guides 27,000 flights, 2.7m passengers and 61,000 tons of cargo every day -- all while driving 5% of our nation's GDP." A4A also pointed out that the bill includes investments in Customs and Border Protection personnel and training for the aviation workforce. The bill also includes changes to the de minimis exemption, which currently allows packages worth less than $800 to enter duty and customs scrutiny free. The exemption has already been removed for packages from China and Hong Kong, where the vast majority of US e-commerce goods originate, but this will be rolled out across the rest of the world starting July 2027. "Significant changes to the De Minimis exception, alongside a surge in Customs and Border Protection funding, will reshape how we handle e-commerce and cross-border compliance. I will continue to engage and support our members through this period," added Fried. "While challenges lie ahead, this Bill is a clear win for forwarders, infrastructure, and the future of air cargo."
Source: aircargonews.net
Read more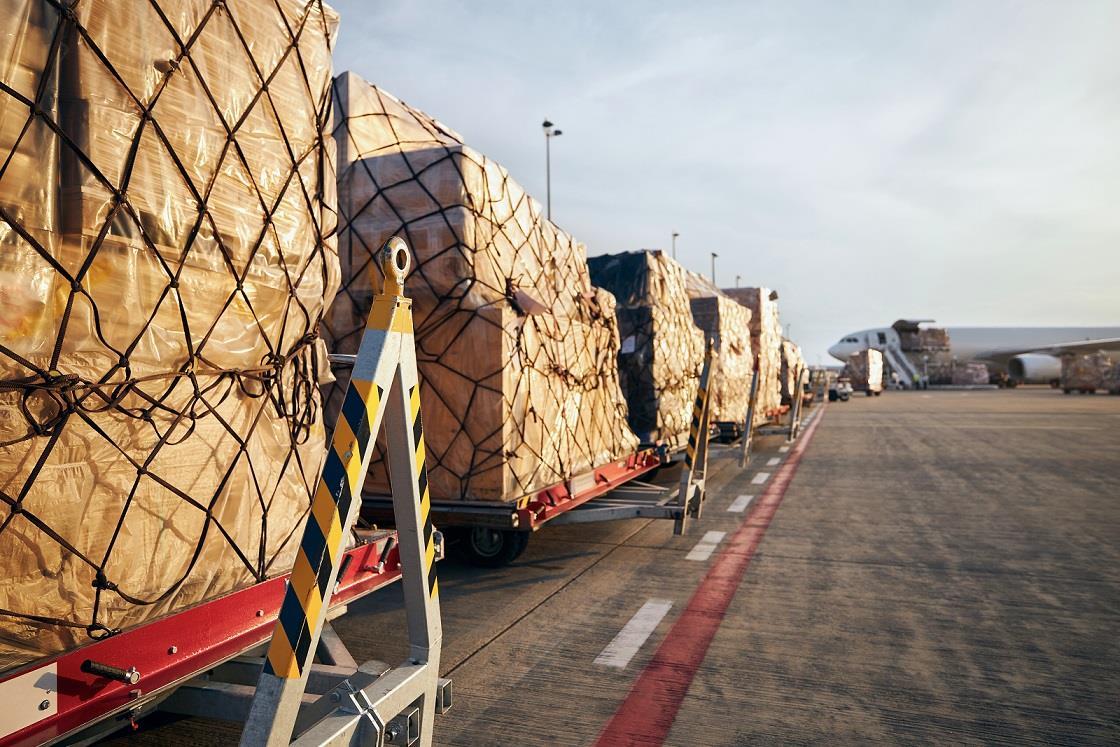
APAC carriers see double digit demand increase in 2024
Asia Pacific carriers achieved a 13.9% year-on-year increase in international air cargo demand in 2024 and a 10% rise in cargo revenue. A surge in e-commerce activity and disruptions to maritime shipping contributed to the 13.9% demand increase, as measured in freight tonne kilometres (FTK), following two consecutive years in decline, according to preliminary figures released by the Association of Asia Pacific Airlines (AAPA). Meanwhile, cargo revenue climbed by 10.3% to $23.2bn, although there was a 3.2% decline in air cargo yields to 32.7 US cents per FTK. Overall, Asia Pacific carriers achieved $7.3bn in combined net profits in 2024, supported by strong growth in passenger traffic and a marked recovery in cargo volumes. Combined operating expenses rose by 8.4% to $199.8bn for the year, due mainly to a 10.1% increase in non-fuel expenditure to $138.9bn Operating costs last year were exacerbated by ongoing supply chain constraints, stated the AAPA. Persistent supply chain challenges, including shortages of spare parts, aircraft delivery delays and aircraft groundings due to engine issues, drove up maintenance and leasing costs. Inflationary pressures also contributed to higher staff expenditure and airport charges. Looking ahead, Subhas Menon, AAPA director general, said: "The region's carriers continue to face considerable headwinds, including elevated operating costs and ongoing supply chain disruptions. "Geopolitical tensions may lead to renewed volatility in oil and currency markets while air cargo markets may soften further, as uncertainties over trade negotiations dampen demand for air shipments."
Source: aircargonews.net
Read more
WiseTech + E2open - margin boost sought to extract maximum value - The Loadstar
Comment / WiseTech + E2open - margin boost sought to extract maximum value Just as Australia's WiseTech (WTC) is understood to be smoothly working on the closing of its transformational E2open transaction, its U$1bn US target quietly reported fiscal Q1 26 numbers last week. Let's look Sifting through the filing lodged with the US Securities and Exchange Commission, E2open's steady (sequential) U$2.37bn asset base at the end of the three months to 31 May was the result of a slightly shifting current assets mix, with cash and cash equivalents fully offsetting (+U$33m) the fall in ...
Source: theloadstar.com
Read more

This website uses cookies and similar technologies, (hereafter “technologies”), which enable us, for example, to determine how frequently our internet pages are visited, the number of visitors, to configure our offers for maximum convenience and efficiency and to support our marketing efforts. These technologies incorporate data transfers to third-party providers based in countries without an adequate level of data protection (e. g. United States). For further information, including the processing of data by third-party providers and the possibility of revoking your consent at any time, please see your settings under “Consent Preferences” and our